MYOB, a well known Australian company, built its business on accounting software that you could purchase in retail stores via floppy disc and later CD/DVD. Businesses would install the software on their local machines and use it to manage their accounts. In its earliest days, MYOB’s customers were largely small to medium enterprises – the software catered for key business scenarios like recordkeeping, and supported the creation of simple reports such as P&L statements and balance sheets.
Over time, some of the businesses that used MYOB’s products grew to be quite substantial. While MYOB also grew in terms of its capabilities, mailing regular software updates to subscribers, the product couldn’t solve all the rich and unique needs of customers. In some cases they began to build on the MYOB product, creating software that integrated with their other systems (e.g. retail POS, inventory, etc.) to automate key business processes. For these businesses, the MYOB software application had become a monolith.
MYOB has pivoted many of its offerings to cloud based SaaS models but as recently as a few years ago were still mailing CD-ROMs to some of their customers, who had built around a MYOB core. Automated deployments? No way. Someone still had to feed the discs into the CD-writer and put them in the mail.
Much like legislation, software components that contribute to key business processes have a tendency to gradually increase in complexity until they become so complicated that it is only safe for experienced experts to interpret them. Using the legislation analogy, monoliths become organisational ‘red tape’ – their brittleness and dependencies create long lead times, unpredictability and risk, stifling growth and innovation.
We are often asked by organisations to assist with improving their product delivery performance. Recently, we were able to deliver a sustained 3 x improvement in speed and predictability, and a 256% increase in throughput after a six month engagement with a client. Organisations can unlock extraordinary productivity and cultural gains by focussing on three key things:
- Organisational designs that enable teams to work together on key objectives with a level of autonomy.
- Structures that eliminate inter-team dependencies.
- De-coupling of high touch components from monolithic applications through microservices, service engines, or similar.
In this blog post we are going to discuss a tool which helps with items (2) and (3) from that list – Brad Quirk’s Monolith Diagnostic. Brad is Elabor8’s nerd-in-residence, a data junkie whose mission is to transform all available data within an organisation to empower them to make informed decisions – from the team level all the way up to the portfolio. With his arsenal of delivery dashboards, cultural pulse checks and forecasting tools, Brad’s ability to close the loop on the antipatterns that occur in large-scale agile environments is second-to-none.
Over to you, Brad:
The Head of Engineering’s fist reverberated against the hardwood roundtable “We need to stop building and start breaking down our monoliths!” The statement was like throwing a tinderbox into the already-raging debate that had become the norm during these fortnightly catch-ups.
I was several months into a role as a Delivery Lead for three teams following a digital-wide agile transformation earlier that year. Surrounded by my peers in the product delivery and technology domains, we were making yet another attempt to formulate a unified strategy that would allow our scrum teams to deliver faster than before.
In any other industry our performance would’ve been seen as middle-of-the-pack, neither stagnant nor spectacular. However, in this particular environment the competition was fierce, customer loyalty was shallow and the only way you could gain a foothold was to be first to market with your product. Simply chasing parity was a sure sign of defeat.
Rather than contributing with some think-out-loud rhetoric in this meeting, dropping some anecdotal evidence pointing to some universally known pain points in the system, I instead took a step back to reflect on the question that I had quickly realised I was yet to explore or even understand fully. Armed with a mountain of JIRA data, a BI tool called Tableau, and a desire to quit the guess work, I set about to answer the question:
What is a monolith, and how do you break one down?
The Basics
From the materials I’d gathered online, there seemed to be an abundance of qualitative means to classify the digital monoliths within a given system, namely:
- The component needs to have many dependencies
- The component needs to take a long time to touch
- The component needs to be regarded as low quality
In the product development world of finite capacity and infinite demand, qualitative data doesn’t cut it. Here’s some quantitative data that I’ve worked up.
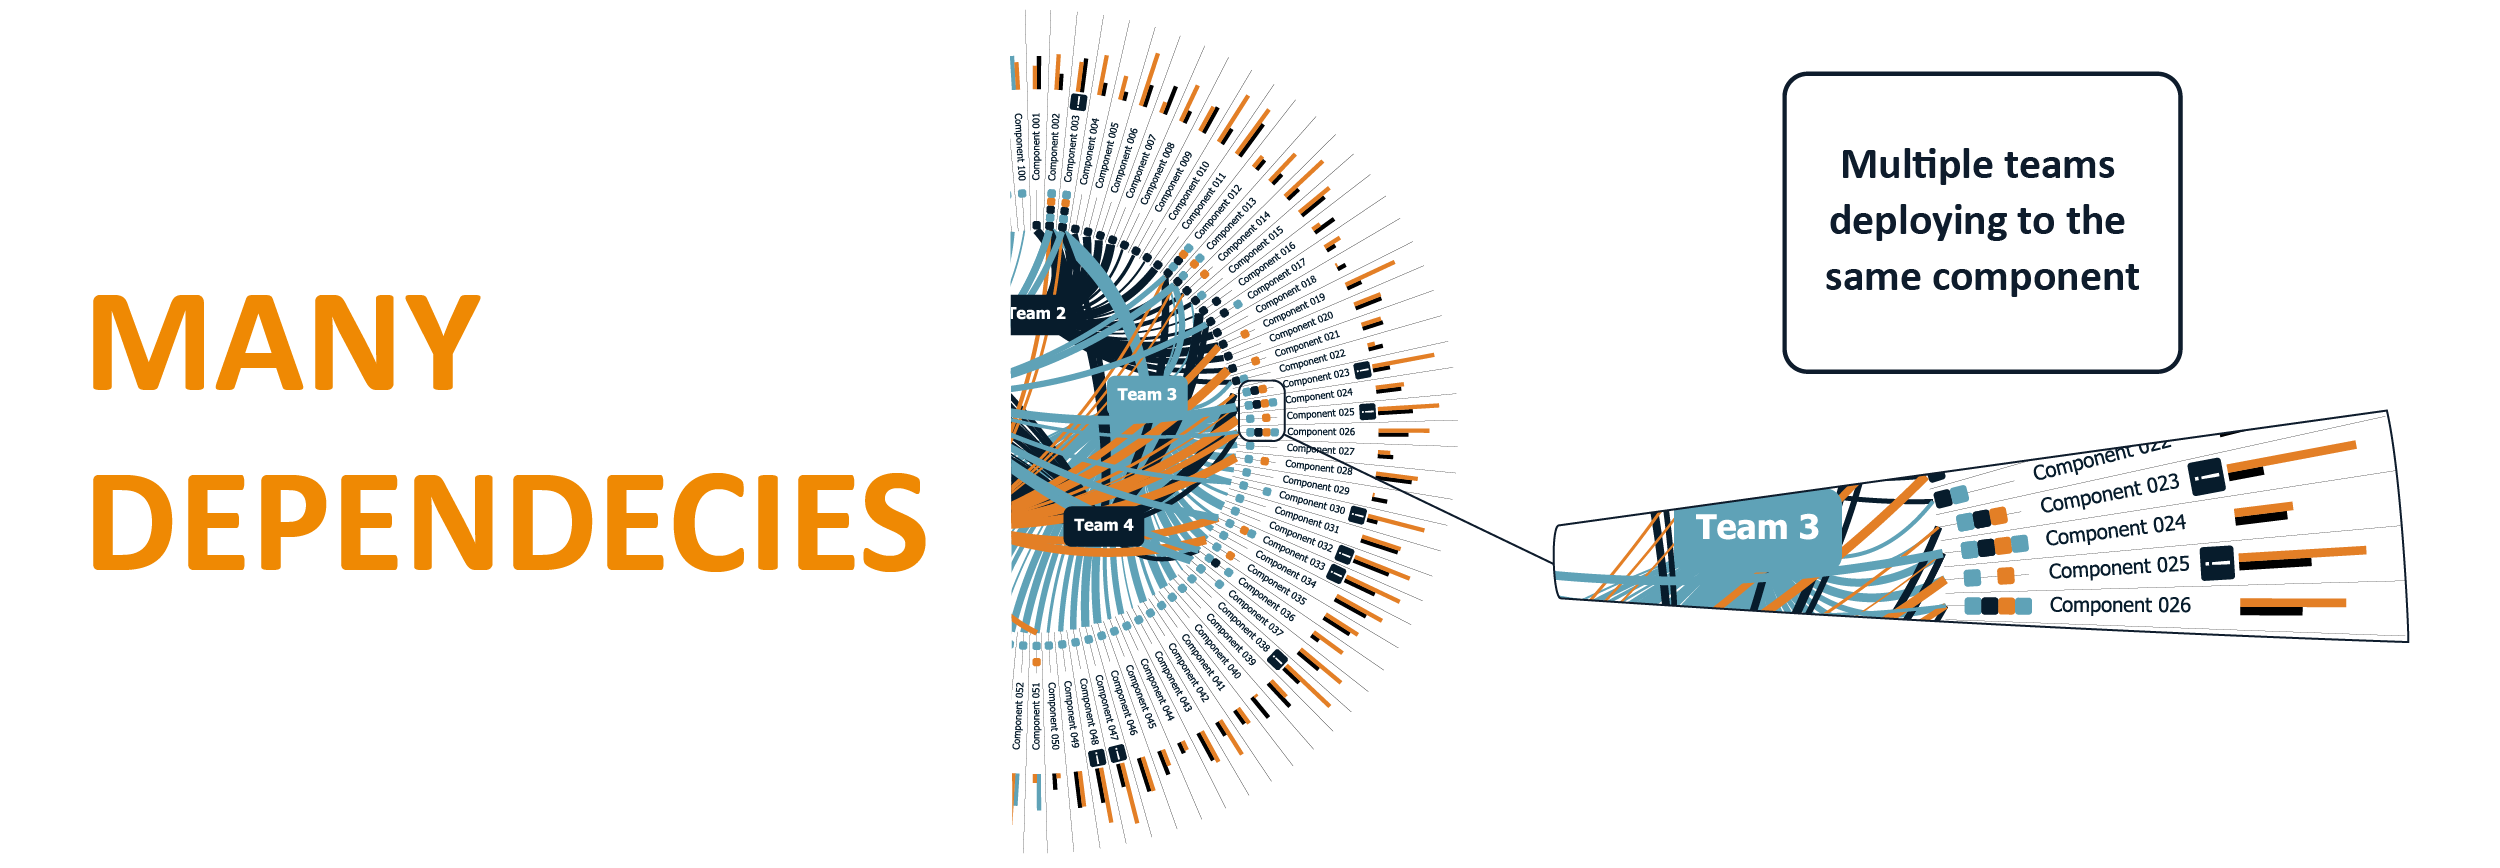
Many dependencies
- Multiple teams are constantly touching the same component, which can lead to significant risks (e.g. merge conflicts, lockstep releases, or even blown away if all parties aren’t in constant communication).
- This problem is usually addressed through changes to the operating model (i.e. component-specialist teams) but this can lead to siloing and localised optimisation, as opposed to systemic improvements.

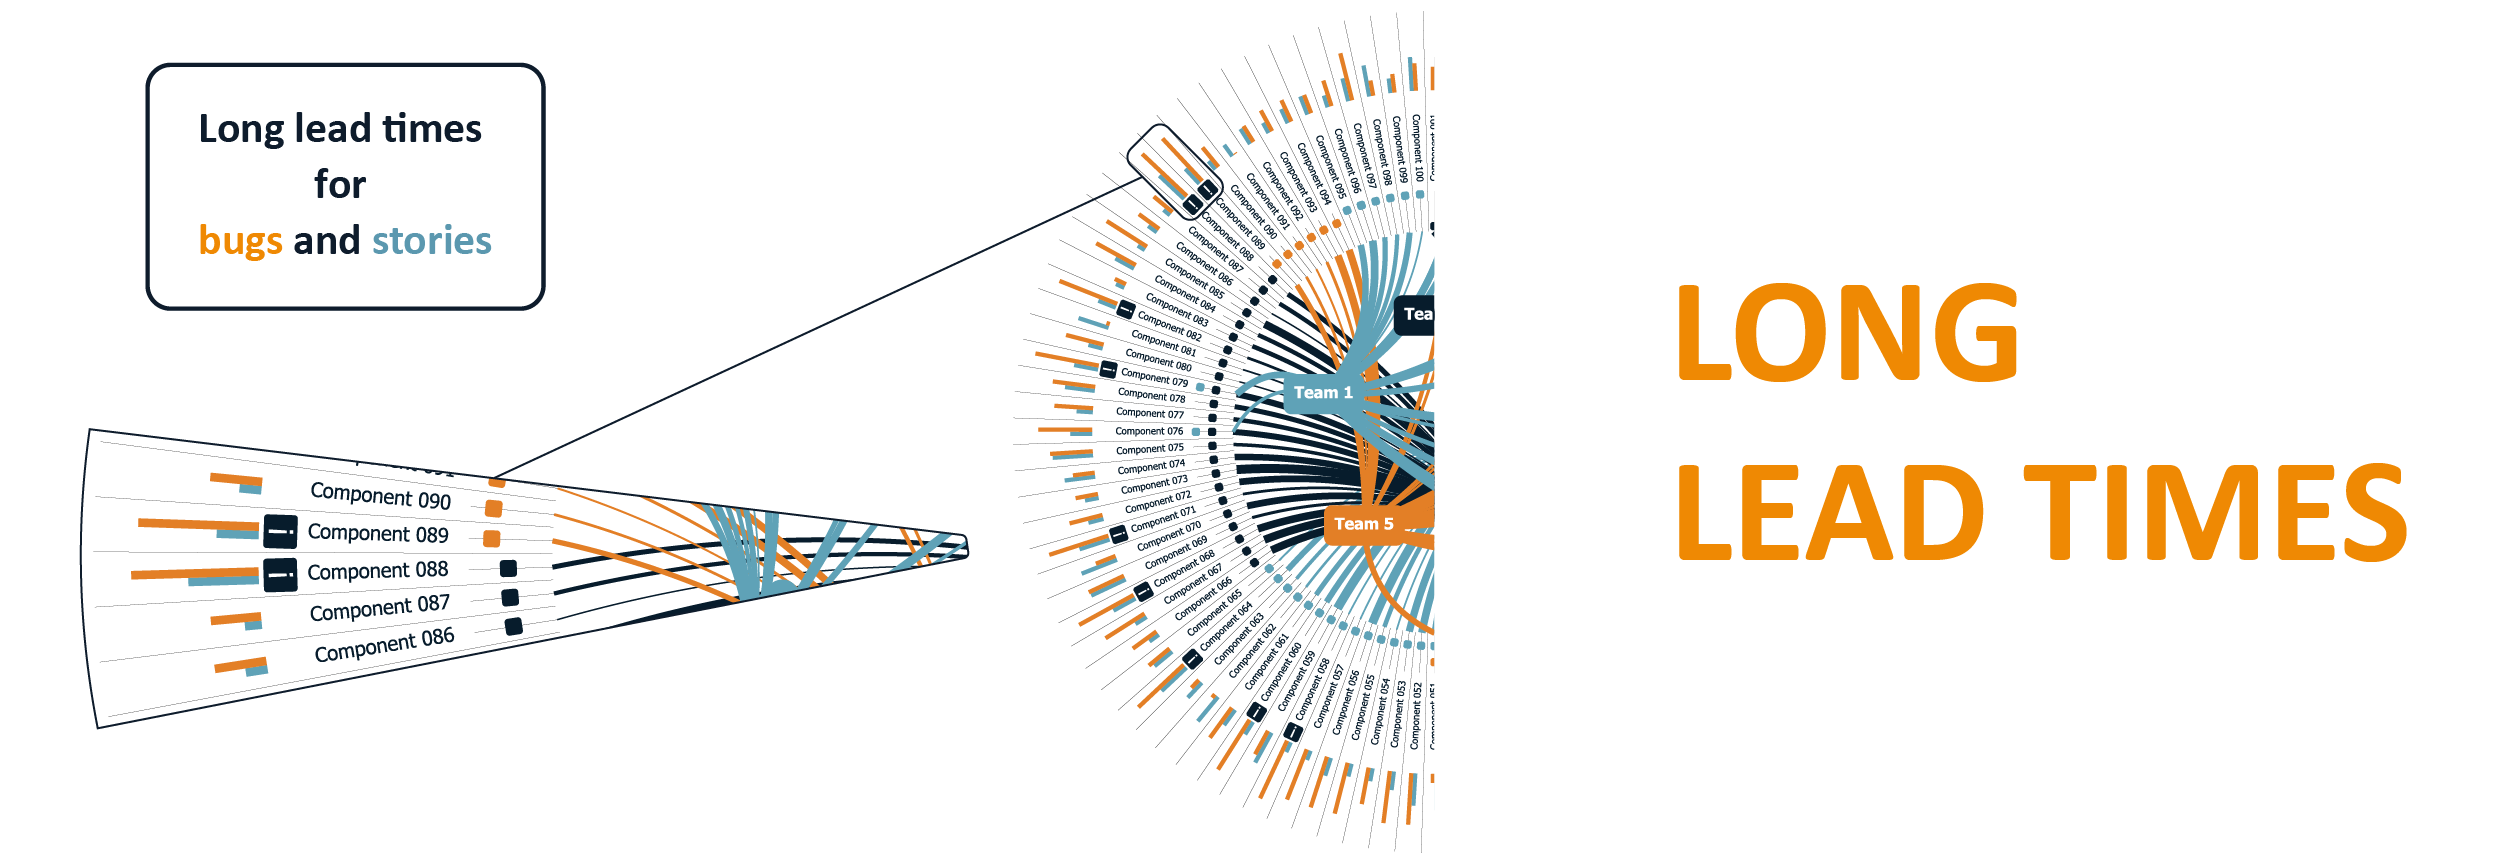
Long Lead Times
- “Too Long” can be defined as anything that takes longer to touch than your usual release cadence (e.g. if you operate in a scrum environment with fortnightly sprints, your monoliths take 10 business days or longer to touch).
- Monthly releases? Twenty business days.
- Have CI/CD processes been installed? Then your monoliths are the ones that take longer than the 85th percentile of your average cycle time.

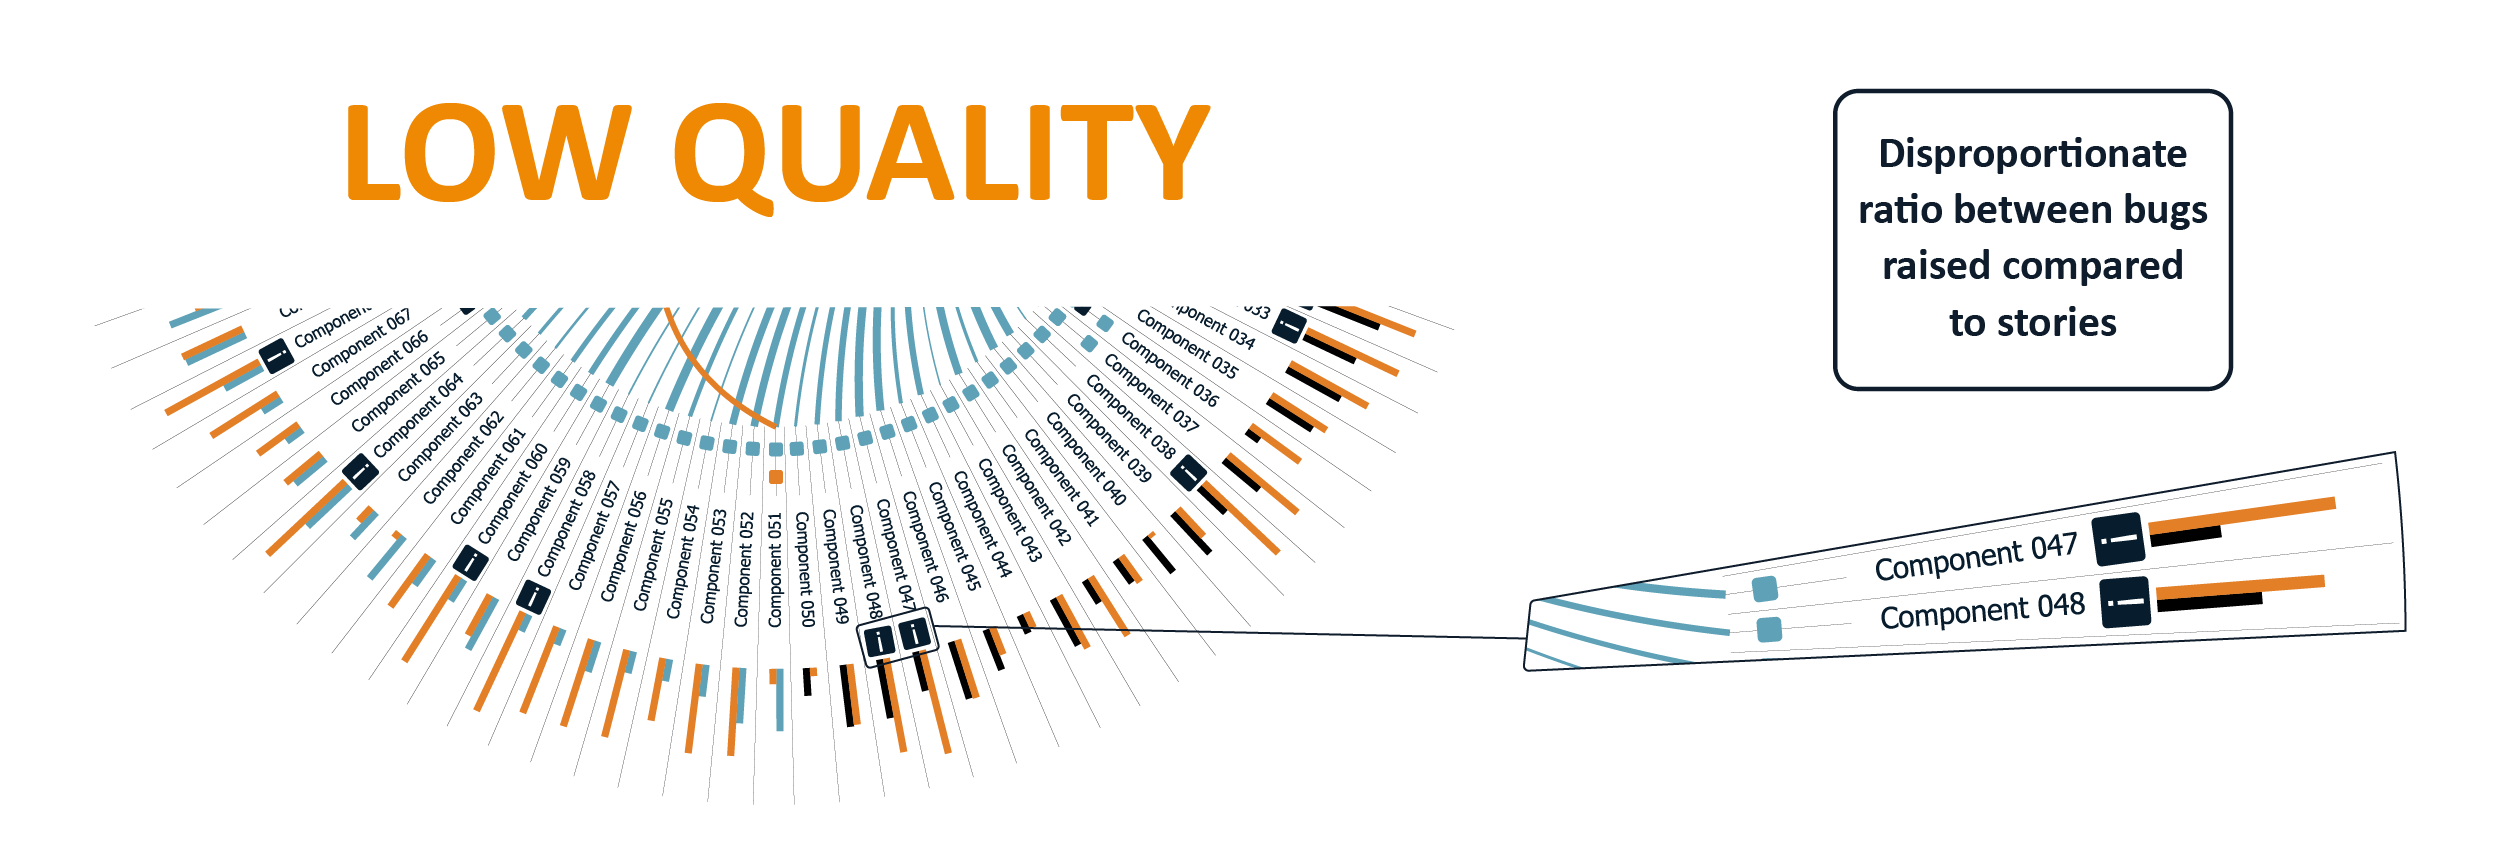
Low Quality
- Lead time distributions help us to understand whether the component is hard to work with. Where there is a large variance in lead times it can indicate that things are unpredictable and brittle.
- Stories that touch the component disproportionately contribute to quality issues. We measure defects as a percentage of stories for each component. Any component that is greater than two standard deviations from the median is considered to have endemic quality challenges.

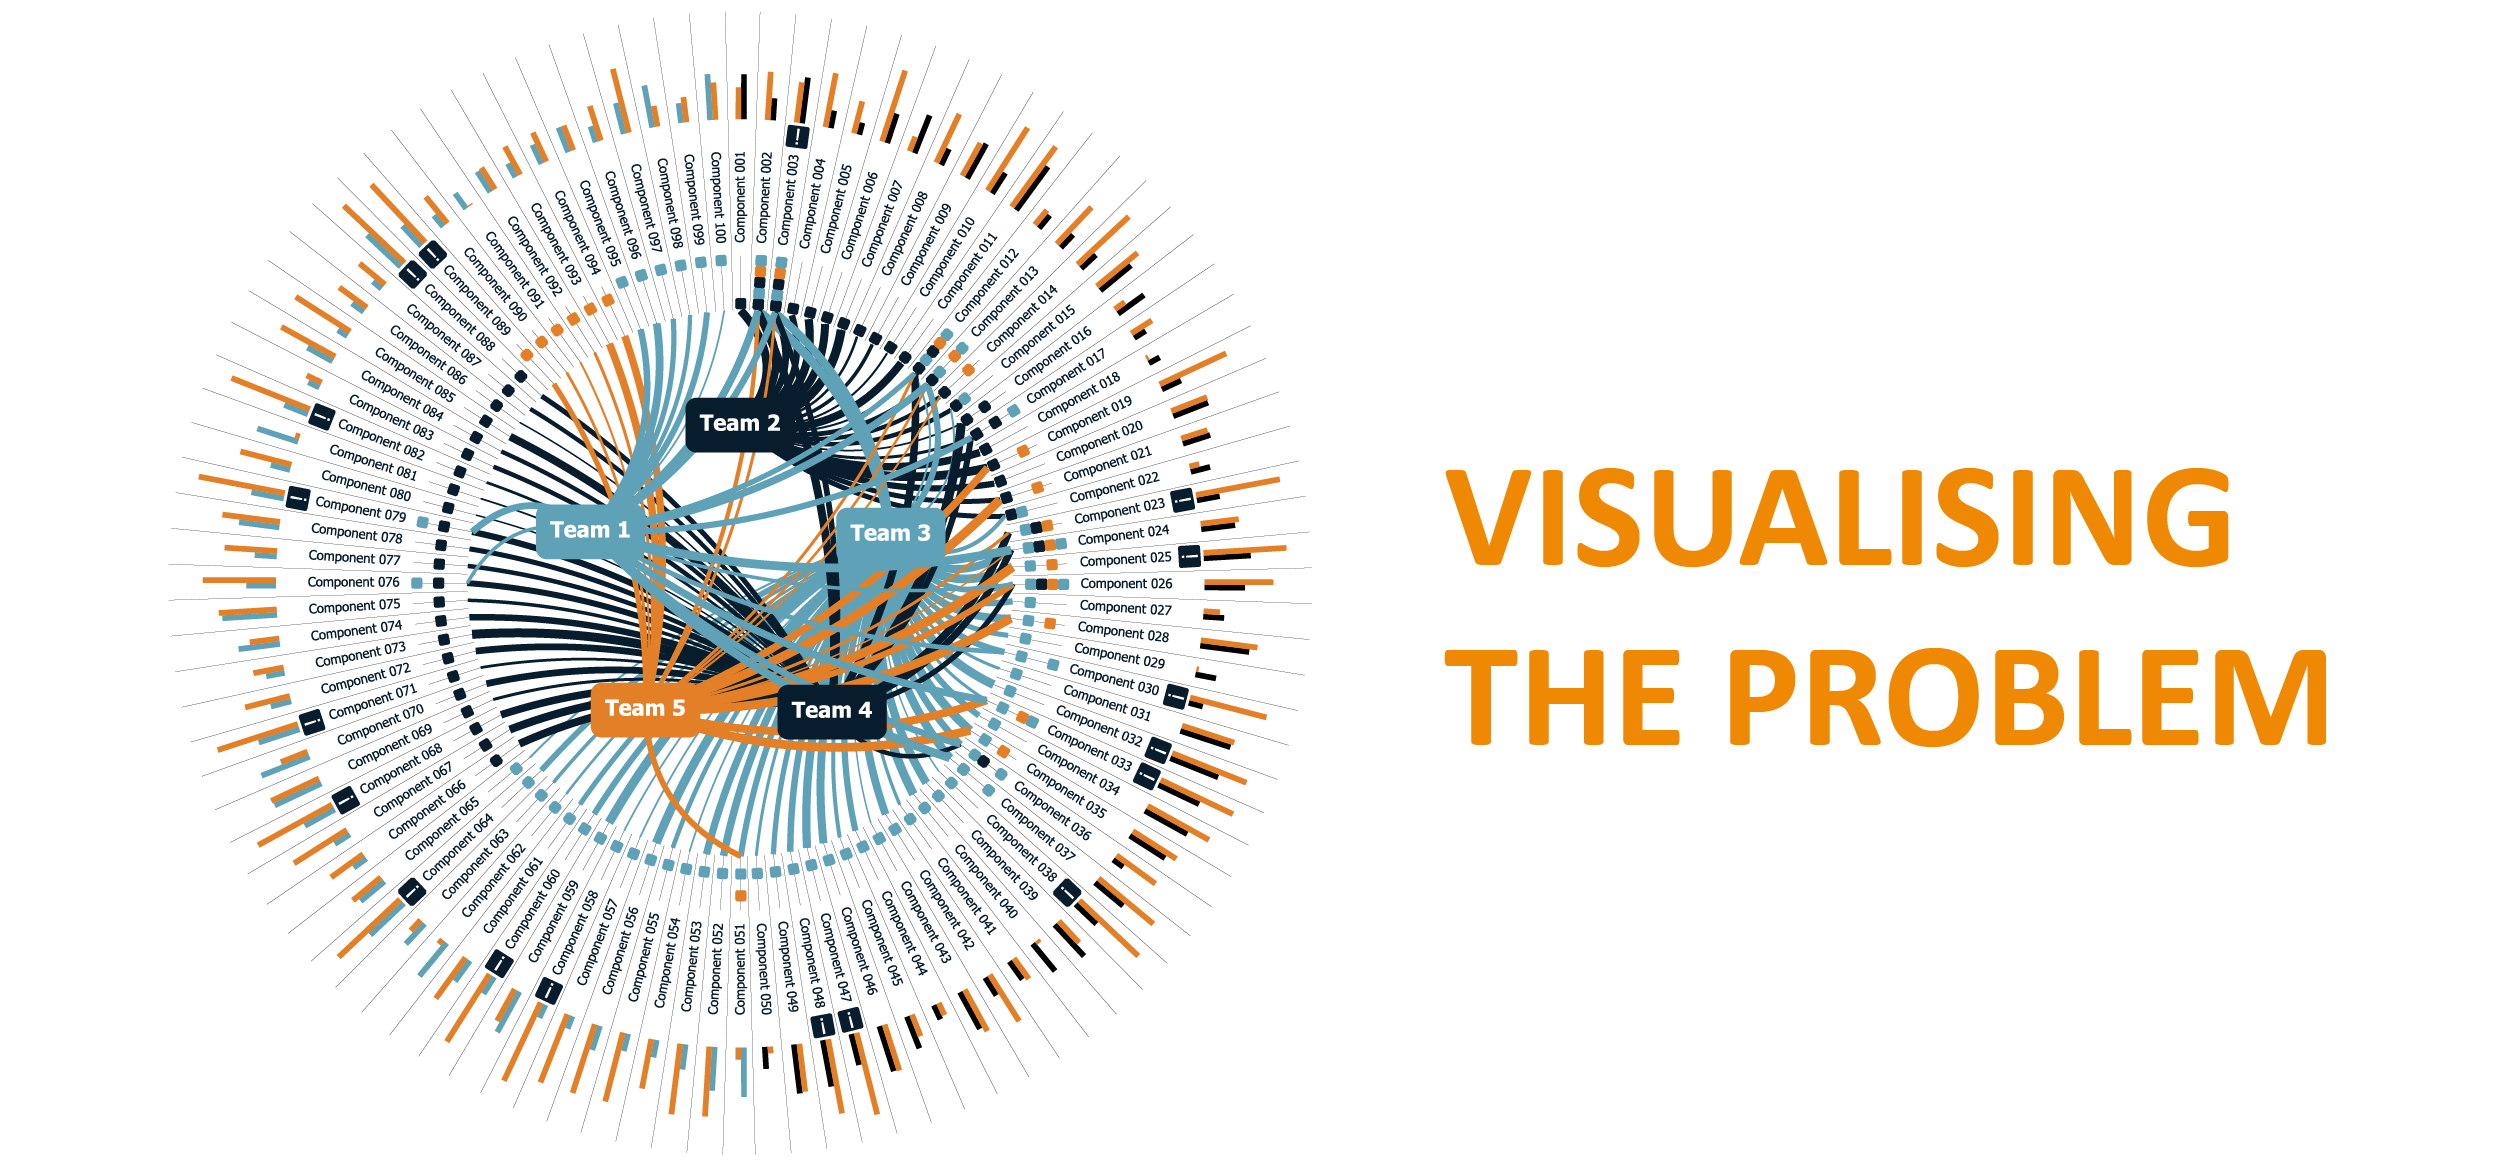
Visualising the Problem
By ensuring that teams tagged the components that they were working on in JIRA, I was able to use Tableau to create this visual representation of the monolith problem.

It enables us to quickly see the components that have multiple touch-points and also enables us to see the 15% and 85% percentiles for Lead Times on the component. We invest our efforts in the components that have the most touch points, the highest lead times, or the most lead time variance.
How to fix it
- Review the patterns or processes that cause the component to take so long to touch. This could involve lengthy sign-off processes, deployment issues, an unfamiliar tech stack, etc.
- Review the cadence upon which you deliver. If it takes a month on average to modify a component, it might be worth adjusting your sprint / release cycle to match that cadence.
- Consider your organisational design. Perhaps a change in team structures could reduce the number of times that different teams touch the same components.
- Invest in decoupling high touch functions from the monolith through service engines or micro-services.
Or, just give us a call. We’re always happy to help.


